Supplier Dashboard
Supplier Dashboard
Once set up, this is the best starting point for future activity. The dashboard lists all suppliers in Abriska and can be filtered by division or contact. The information provided is as follows (from left to right):
- If completion of the questionnaire is overdue, then a coloured box/square will appear against the supplier (colour can depend on account settings, typically this is mustard yellow)
- The supplier name is provided along with the drill down to review the supplier profile and full information held against that supplier
- Categories assigned to the supplier, which determine the question sets. Selecting the symbol allows the categories to be viewed in list form and to amend them.
- Supplier contact
- Name of the division that owns the relationship with the supplier
- Name of the internal person owning the supplier relationship
- Risk rating based on the responses to the questionnaire
- View questionnaires link
- Questionnaire status indicator: completed, in progress, questionnaire ready but not sent, no questionnaires
Supplier Dashboard explained
What risk is being shown in the dashboard?
The dashboard risk rating reflects the responses to the latest questionnaire based on the risk appetite thresholds applied. It is worth noting that a low risk supplier that does not meet the risk appetite thresholds assigned will show as ‘red’. Please see SRM Setup risk rating.
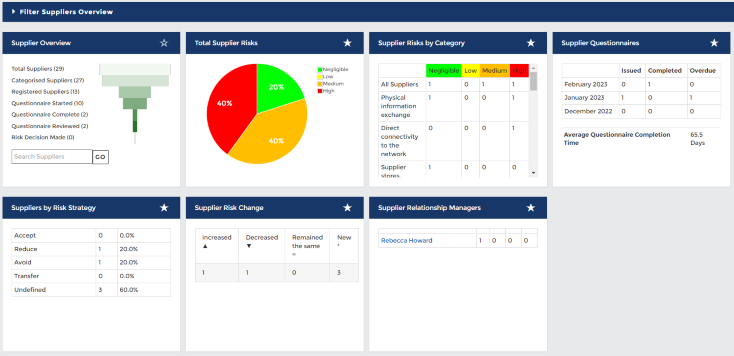
Suppliers Overview
This overview page provides a comprehensive summary of key areas of information about your suppliers. This is split into several widgets, detailed below.- Total Supplier Risks - This represents what risk levels make up your active supplier list. Scores are based on the most recently completed questionnaire.
- Supplier Risks by Category - We have broken down risk levels into supplier categories, offering a high level view of controls effectiveness by category. It is important to note that since each supplier can be assigned to more than one category, the column total may be greater than the number of suppliers in the system.
- Supplier Questionnaires - We have introduced tracking on questionnaires issued, overdue and completed to help users identify trends on when best to send questionnaires or to extend return dates. This widget will show you the average completion time for a questionnaire of all suppliers or per a division.
- Suppliers by Risk Strategy - This widget represents how many suppliers fit into the various risk strategies based on your risk treatment plan.
- Supplier Risk Change - This widget helps you view how your supplier risks change over time. This is for suppliers who have completed more than one questionnaire. E.g. total suppliers 30, 20 have completed their second questionnaire, 10 may have an increase in their risk level, 5 may have decreased, and 5 may have remained the same. The remaining 10 with only one questionnaire completely would reside within the ‘New’ group.
- Supplier Relationship Managers - Provides a breakdown of how many suppliers are assigned to a Relationship Manager (Owner within the asset setup page)
- Supplier Overview - Details how many suppliers have been added to Abriska, the number categorised, registered, those that have started and/or completed a questionnaire, the number of questionnaires reviewed, and the number where a risk decision has been made. The supplier overview page can be filtered by division.
Adding Overview widgets to the home dashboard
For all widgets within the supplier overview page, you can select which to apply to the home dashboard by clicking the star in the top right hand corner of each widget. The white star indicates the widget is not part of the home dashboard page; the grey outlined star indicates it is part of the home dashboard page.Controls Effectiveness
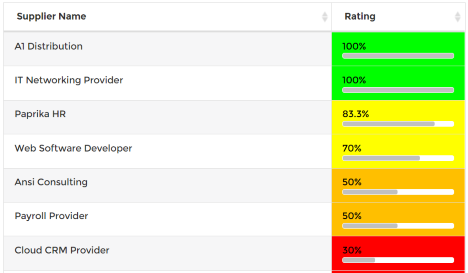
This provides, on a per-control basis, an overview of the control effectiveness for each supplier where the control has been assessed. This is a good way to quickly see whether there are common control weaknesses across the supply base and will support deep dive reviews on specific controls. From the Supplier Dashboard. Select ‘Controls Effectiveness’ and then select the control of interest from the drop-down menu on the main page. The list of suppliers, along with the control rating, will appear on the screen.
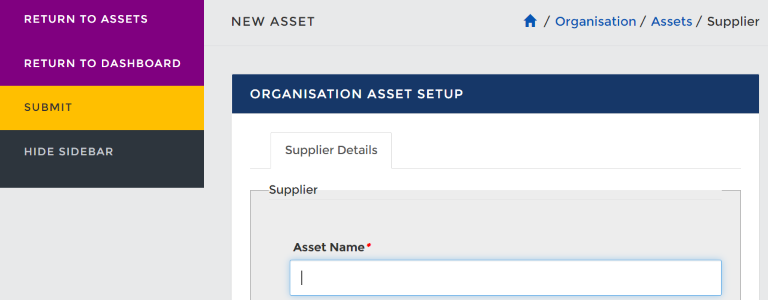
Adding a New Supplier
New suppliers can be added via the Supplier Dashboard under Supplier Risk Management ‘Add New Supplier’ or through Organisation under ‘Asset/Resource’, ‘Create New Asset/Resource’. Both routes end at the same place within Abriska.- Under Create New Asset/Resource, complete the required fields and ensure that ‘Supplier’ is selected under ‘Asset/Resource Type’ and then ‘Submit’.
- From the Asset/Resources page, the new supplier will appear on the main page. Select the supplier and a new page opens up to enable more information to be added.
- Within the main page there are now four tabs visible. The first tab is ‘Supplier Details’, which is the data previously entered, the second is ‘Asset/Resource Dependencies Chart’, the third is ‘Questionnaire Workflow’ and the fourth 'Documents'. For more details on these tabs please see Supplier Details and Questionnaire Workflow.
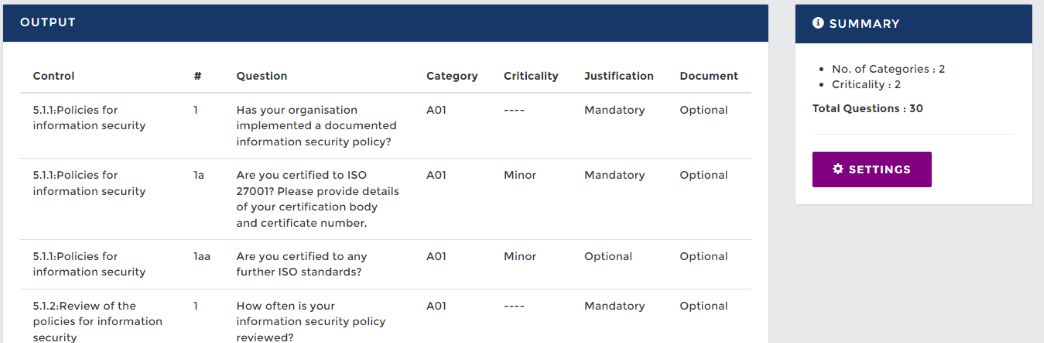
Questionnaire Previewer
Questionnaire Previewer can be used to test changes to control/category association, check how many questions a supplier may receive based on their linked categories and enable you to view a questionnaire before it is sent to a supplier. To utilise this, go to the Supplier Dashboard page > left panel 'Questionnaire Previewer' > select the 1-3 (or 1-5) scale of impact criticality > select the categories you want to check > generate the questionnaire. This will show you which controls are part of this questionnaire and the associated categories as well as the desired answers.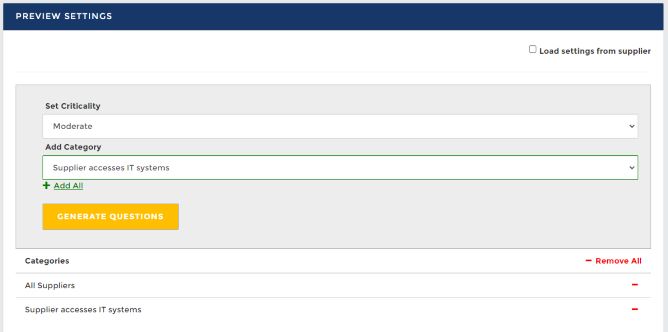
Return to Supplier Risk Management